Introduction
Certified Child Life Specialists (CCLSs) are pediatric psychosocial care professionals who are uniquely equipped to help children and families understand and cope with stressful life situations, most commonly hospitalizations and other healthcare encounters (Boles et al., 2020; Romito et al., 2021). Throughout a typical work shift, these providers conduct psychosocial assessments and, in response, offer an array of individualized supports to promote self-expression and adaptive coping during potentially traumatic events (Romito et al., 2021). These patient- and family-centered interventions and care plans they develop may include procedural support (e.g. supporting patients through port access), patient education (e.g., educating children and families on a diagnosis or treatment), coping and normalization support (e.g., creating personalized school re-entry materials), family support (e.g., facilitating a sibling visit), bereavement support (e.g., memory-making after sudden fatalities), and coping skills training (e.g., teaching breathing techniques to utilize during times of distress).
Training to work as a CCLS requires a bachelor’s degree, completion of 10 specific collegiate courses related to child life (e.g., child development, play, family systems, child life, bereavement, research, electives related to child development/family studies or child life), a 600-hour clinical internship under CCLS supervision, and successful passing of the Child Life Certification Examination (Child Life Certification Commission, 2024). Alongside these requirements, however, individual hiring institutions retain the authority to request or prefer elevated educational or training expectations for some or all child life specialist positions.
The benefits of child life services for children, families, healthcare teams, and healthcare organizations are well documented (Boles et al., 2020). The American Academy of Pediatrics has asserted that child life services are essential for meeting the holistic needs of pediatric patients and their families (Romito et al., 2021), and child life staffing is a recommended or required element of care for critically ill children and youth per the Society for Critical Care Medicine (Smith et al., 2022). According to Boles and colleagues (2020), child life services and outcomes can be organized into five broad categories. First, they support healthcare consumership, encouraging patients to seek healthcare early and often throughout their lives. As childhood healthcare encounters have lifelong impacts (Burns-Nader et al., 2017), the support received from a CCLS can significantly improve lifetime usage of health services (Boles et al., 2020). Second, interventions from CCLSs reduce healthcare-related costs for families and institutions (Boles et al., 2020; Romito et al., 2021), through mechanisms such as reduced need for anesthesia (Grissom et al., 2016; Scott et al., 2016) and enhanced non-pharmacological pain management (Hyland et al., 2015). Third, CCLSs promote children’s development and engagement through play-based, coping-focused interventions shown to reduce pain, lower anxiety, reduce distress, and thereby free up physiological, cognitive, and social-emotional energy for crucial developmental processes and growth (Boles et al., 2020; Romito et al., 2021). Fourth, CCLSs empower children and families to become informed, active participants in their own care, improving patient and family engagement, increasing patient cooperation (Sanchez Cristal et al., 2018), and facilitating therapeutic visitation in potentially stressful environments such as intensive care (Desai et al., 2020). Finally, CCLSs support children’s development by offering developmentally appropriate coping supports such as play (Burns-Nader & Hernandez-Reif, 2016; Gariepy & Howe, 2003; Moore & Russ, 2006; Wong et al., 2018), thus promoting and sustaining improved developmental and psychosocial outcomes from infancy through emerging adulthood (Boles et al., 2020).
Despite their perceived and demonstrated necessity, child life specialists in child life programs in North American have seen large-scale turnover – termed “the staffing crisis” - in recent years (Association of Child Life Professionals [ACLP], 2023; Burns-Nader, Daniels, et al., 2026; Jenkins et al., 2023). Some emerging research has illuminated the barriers and burdens child life specialists experience to explain and address this phenomenon. These studies have shown that CCLSs are prone to burnout, compassion fatigue, and job dissatisfaction (Burns-Nader, Daniels, et al., 2026; Fisackerly et al., 2016; Lagos et al., 2022). Furthermore, in the child life profession these factors are also often linked to low compensation (Burns-Nader, Daniels, et al., 2026; Ehinger & Bales, 2023; Ginter, Dumas, et al., 2024; Hoelscher & Ravert, 2021). Low salary has been noted in the child life profession for many years (Burns-Nader, Daniels, et al., 2026; Cross et al., 2018; Hoelscher & Ravert, 2021).
Although the Association of Child Life Professionals (ACLP) has provided salary information through membership-based salary surveys and reports, these resources primarily provide descriptive, non-empirical compensation data based on self-reported information from child life professionals. To date, there has been no peer-reviewed research systematically examining compensation among child life professionals and the individual and organizational characteristics associated with differences in compensation. Therefore, the purpose of this study was to explore the status of child life compensation practices and trends in the United States. Specifically, the following research questions were examined:
-
What is the average compensation of CCLSs in the United States?
-
What factors (individual, institutional, geographic) appear to impact compensation practices and trends in the child life profession in the United States?
Methods
This quantitative study used a cross-sectional, descriptive design to assess compensation in child life programs across the United States. Given the geographic spread of pediatric healthcare facilities housing these programs, and the variation that could be present across programs of varying size, location, and structure, an electronic survey-based design was chosen to support sample diversification.
Participants
Preceding recruitment, exempt-level approval was received from the Institutional Review Boards of the authors’ university affiliations in the Southeast United States (24-04-7584). To best examine the state of compensation in child life specialist programs, it was necessary to recruit child life program leaders who would have more in-depth awareness of and access to this type of administrative information. Therefore, participants in this study were individuals currently employed as the manager or director of a child life department in a healthcare setting in the United States. Eligible participants were recruited using informational flyers that were distributed on ACLP Connect (the internal social networking platform of the ACLP), two child life professional Facebook pages (“Certified Child Life Specialists” and “Child Life Connection”) and the personal and professional social media pages and emails of the study team members. Flyers were also disseminated directly to professional contacts held by the author team and were shared with the “Past Presidents” email group maintained by the Association of Child Life Professionals. These information flyers were distributed once per month between May 2024 and January 2025.
Procedures
Potential participants expressed interest and began the study using the QR code or hyperlink in the informational flyer. Selecting either of these led the participant to the secure REDCap platform where they first encountered a consent form; upon providing electronic consent, participants began a demographics and program characteristics survey that gathered information about both them and their child life program. Many participants chose to end their involvement in the study after completing this survey.
After the demographics and program characteristics survey, all participants were invited to submit a supplemental spreadsheet with detailed information about their child life specialist employees’ job titles and compensation. These spreadsheets could be uploaded to the survey or emailed to the research team, depending on participant preference. At times, child life program leaders reported they did not have complete access to the information required to complete the spreadsheet. In these instances, compensation specialists or team members from the institution’s human resources departments were invited to complete the spreadsheet on the participant’s behalf. Completed surveys and spreadsheets were exported from REDCap and uploaded to a password-protected secure file on Box, a HIPAA compliant storage platform only accessible to the research team.
Measures
Demographics and Program Characteristics Survey. The questionnaire was developed by the research team and included questions about participant background information (age, gender, race, ethnicity, education level, number of years in the child life leader role) as well as information about their child life program. Information about the child life program included type of institution, location, unionization, and salary variables (e.g., offered benefits for full- and part-time child life specialists, availability of merit raises, mechanisms for raises). The survey consisted of 20 questions and took approximately 3 to 5 minutes to complete (see Appendix A).
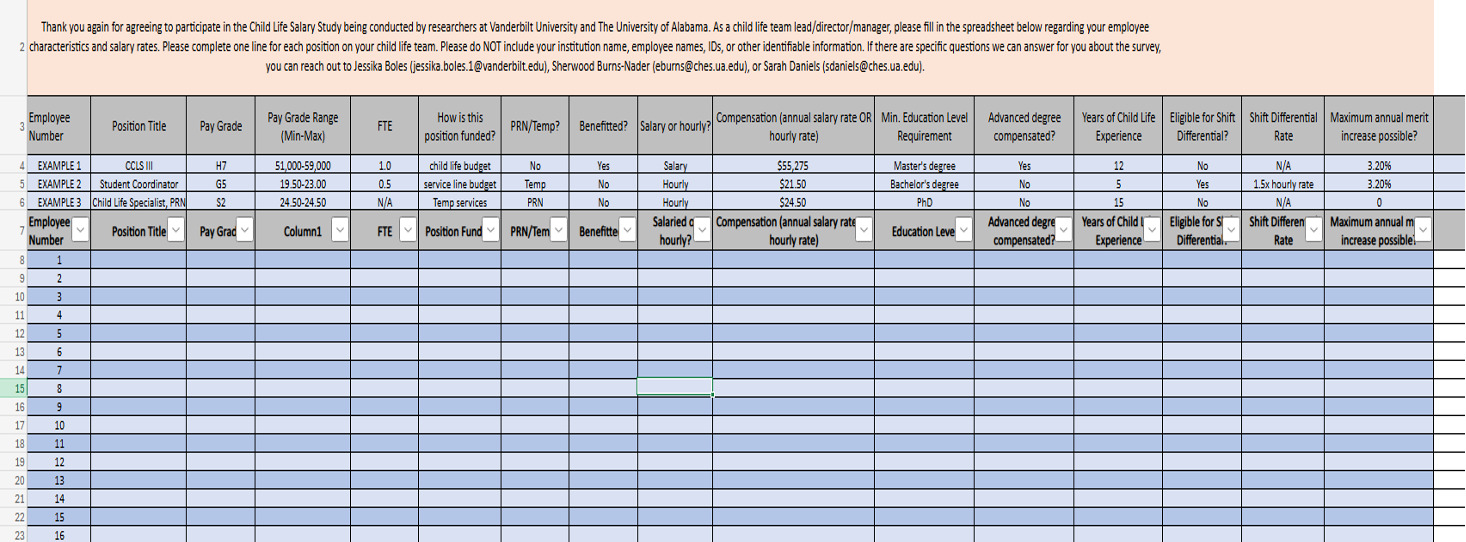
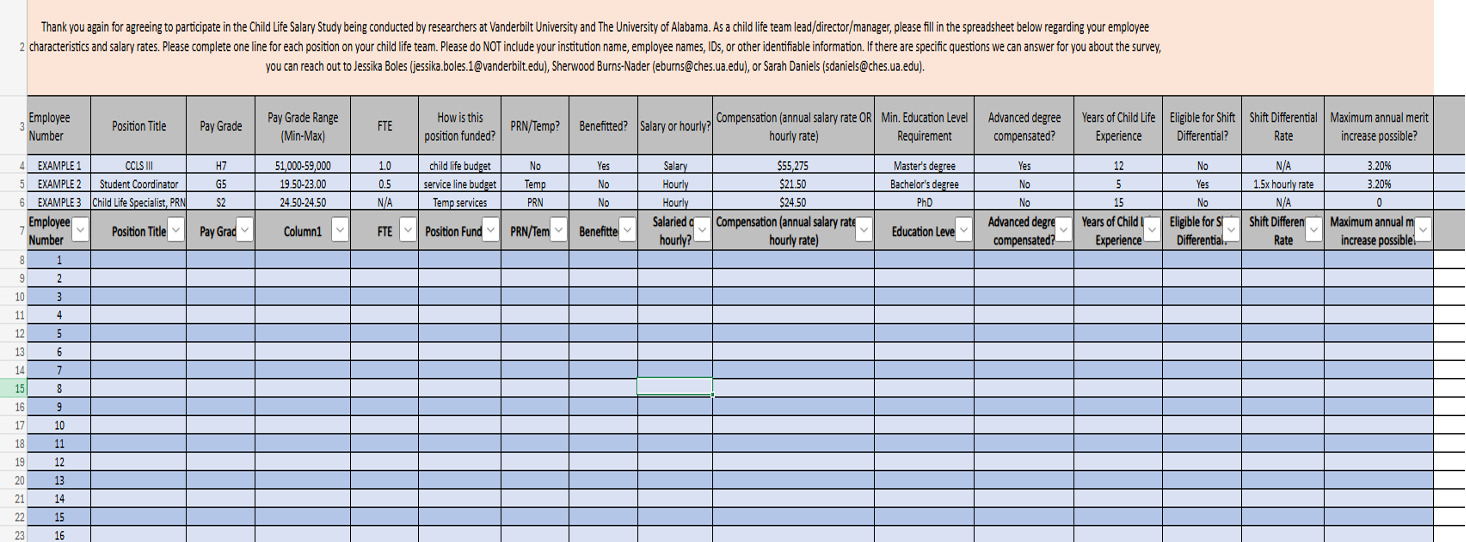
Child Life Salary Spreadsheet. The research team developed this tool in Microsoft Excel to collect comprehensive information on the titles and salary grades of members of the child life team, across directors, coordinators, child life specialists, and child life assistants. Child life leaders were asked to download the spreadsheet and provide information on employee characteristics and salary rates for every member of their child life team without including any identifying information, such as hospital name or employee name and/or ID. Data collected through this tool included the following variables: position title, salary grade, salary range, full time equivalency (FTE), position funding, benefit eligibility status, salary/hourly, compensation amount, education requirement, years of child life experience, shift differential eligibility, and merit range rate (see Appendix B).
Data Analysis
IBM SPSS Statistics (version 29) was used to conduct all analyses. Descriptive statistics (i.e., frequencies, percentages, means, and standard deviations) were used to summarize participants’ demographic information and to characterize program information. To best meet the aims of this study, descriptive analyses were first conducted using participants’ actual reported compensation (salaried or hourly; full-time or part-time). To facilitate comparability across positions with varying pay types and employment types, a standardized compensation variable was computed by annualizing reported earnings based on full-time equivalent status.
Bivariate analyses were used to explore group differences in compensation using independent samples t-tests, one-way analyses of variance (ANOVA), and Kruskal-Wallis tests when parametric assumptions were not met. Variables considered to be conceptually relevant to compensation were entered into a multivariable regression model. Statistical significance for all analyses was set a priori at p < .05. Valid sample sizes varied across analyses. Pairwise deletion was used for missing data during descriptive and bivariate analyses, while listwise deletion was used for the final regression model.
Results
Survey Results
Participant and Program Characteristics
Seventy-one child life leaders participated in the survey portion of the study. Participants were predominantly White (n = 68, 95.8%), non-Hispanic/Latinx (N = 68, 95.8%), females (N = 69, 97.2%) with a mean age of 42.9 (SD = 9.0) and a master’s degree (N = 43, 60.6%). Most participants listed their position title as a child life director (N = 18, 25.4%), director of a group of psychosocial services (e.g., Director of Child Life and Music Therapy) (N = 16, 22.5%) or Certified Child Life Specialist (N = 13, 18.3%). On average, participants were in the leader role for 9.6 years (SD = 7.6), and most worked at a children’s hospital within an adult hospital (N = 25, 35.2%) or a free-standing children’s hospital (N = 21, 29.6%). Almost 92% of the participants worked full-time (N = 65). Most of the programs represented in the survey were not unionized (N = 61, 85.9%) and were in the South (N = 28, 39.4%) or Northeast (N = 20, 28.2%). See Table 1 for additional information on participant and program characteristics.
Benefits and Salary
The most common paid benefits reported for full-time employees were health insurance (N = 70, 98.6%), life insurance (N = 63, 88.7%), and retirement matching (N = 63, 88.7%), while the least common were subsidized childcare (N = 10, 14.1%), ACLP membership dues (N = 15, 21.1%), and certification maintenance fees (N = 18, 25.4%) (see Table 2). When asked what profession with which they felt a CCLS’ salary should best align, most child life leader participants chose social work (N = 40, 56.3%) (See Table 3). Annual merit raises were available in many of the programs represented in the survey (N = 58, 81.7%); of those programs offering merit raises, 55 provided information on the size or range of these raises (see Table 4). Reported percentages ranged from 1 to 7%, with 3% most frequently cited (N = 17, 30.9). Participants reported the advancement of clinical ladder (N = 29, 40.8%), taking on leadership roles (N = 26, 36.6%), years of experience (N = 25, 35.2%), and student supervision (N = 5, 7.0%) as mechanisms for moving salary grades, with 7 (9.5%) participants saying that none of these were possible. When asked to describe any other opportunities for moving salary grades, market analysis was the only new mechanisms noted; however, several child life leaders (N =8, 11.3%) used this space to emphasize there were currently no mechanisms for moving salary grades in their program.
Child Life Position Funding
Within the last five years, the number of new child life positions funded in reporting programs ranged from 0 to 20 (M = 2.89, SD = 3.5). Over 64% of the programs who responded to this question (missing N = 3, 4.2%) were able to fund between 1 to 6 positions over the last five years (N = 46, 67.7%), with 1 funded position most often reported (N = 12, 17.8%) (see Table 5). A few of the participants (N = 17, 25.0%) detailed reasons desired positions were not funded, including expectation of shifting existing positions to accommodate needs, not being considered a fundable program by hospital operations, inability to fill current positions, budget constraints (e.g., hiring freeze, hospital cuts), and lack of institutional support.
Child Life Salary Spreadsheet Results
Sample Characteristics
Prior to analysis, some entries were removed from the sample due to ineligibility or insufficient data, including one child life assistant, one non-CCLS position, six unfilled positions with incomplete compensation data, and one program with insufficient data provided across all positions. The final analytic sample included 180 positions staffed across 16 programs. Descriptive characteristics of categorical variables, including position, pay type, employment type, region, funding source, benefit eligibility, required education level, whether advanced degrees were compensated, and merit increase status are included in Table 6. Years of paid work experience accumulated across positions ranged from 0 to 39 years (M = 10.44, SD = 9.48).
Compensation Descriptives
Actual Compensation. Programs reported on actual compensation rates for their current CCLS staff. Considerable variability was observed across the sample in how compensation was reported, particularly with respect to hourly versus annual salary.. Therefore, descriptive characteristics (sample size, minimum, maximum, mean, and SD) for actual reported compensation are presented separately for pay type (salaried versus hourly positions) in Table 7.
Standardized Compensation. In addition to variability in notating hourly versus annual salary compensation rates, not all positions reported were 1.0 FTE, full-time roles. To ensure comparable comparisons across groups, actual compensation was transformed for each position to reflect what each position would earn annually when working full-time for a full year. Table 7 summarizes this standardized compensation variable by employment status, pay type, position type, geographic region, and preferred education.
Compensation Differences Across Position Characteristics
Bivariate analyses were conducted to examine different factors associated with standardized compensation rates. A Pearson correlation was performed to explore the relationship between years of work experience and compensation; this found a strong, positive relationship (r (142) = .75, p <.001). CCLSs who had more years of work experience, had higher standardized compensation. Independent samples t-tests were used to examine the relationship between standardized compensation and variables with two categories (employment type and pay type). There was not a significant difference in compensation observed between full-time (M = 66,099.02, SD = 19,247.28) and part-time (M = 64,055.70, SD = 11,682.18) employment types (t (132.21) = 0.84, p = .404, d = 0.12), suggesting that compensation is similar across employment types. There was a significant difference between the compensation for salaried (M = 69,245.84, SD = 20,535.41) and hourly roles (M = 60,370.61, SD = 10,064.16, t (150.95) = 3.78, p <.001), with a moderate effect size (d = 0.53), suggesting that salaried roles tend to be higher paying than hourly roles.
To explore differences in standardized compensation across variables with three or more categories (position type, geographic region, required education), Kruskal-Wallis tests and one-way ANOVAs were used. A Kruskal-Wallis test indicated that there was a significant difference in standardized compensation by position type (leadership, staff, and other), (H(2) = 45.44, p < .001). Post-hoc Dunn-Bonferroni analyses showed that staff positions differed significantly in compensation from both leadership (p = .000) and other positions (p = .002), whereas compensation did not significantly differ between leadership and other positions (p = .399). Staff positions demonstrated significantly lower compensation than both leadership and other positions. A Kruskal-Wallis test analyzing differences in compensation across region (Midwest, Northeast, West, and South) did not reveal any significant differences (H(3) = 5.12, p = .164).
A one-way ANOVA was conducted to examine differences in standardized compensation by required education level (Bachelor’s, Master’s, and Master’s preferred). Compensation differed significantly by education requirement (F(2, 155) = 3.33, p = .038). A post-hoc Tukey HSD test showed that compensation was significantly higher for positions preferring a Master’s degree than for positions requiring a Bachelor’s degree (p = .029). There were no significant differences in compensation between the other required education groups.
Predictors of Child Life Compensation
A multiple linear regression model was used to examine predictors of standardized compensation, including years of experience, pay type, position type, and required education (Table 8). Despite being conceptually relevant, regional differences were not found to be statistically significant at the bivariate level. Additionally, after listwise deletion was applied in preparation for the multivariable model, sparse cell counts emerged across regional categories. Therefore, region was excluded from the final model to improve model stability and interpretability. The overall model was statistically significant (F(6, 137) = 60.02, p < .001), explaining 72.7% of the variance in compensation (R2 =.727; adjusted R2 = .715). In other words, the variables included in the model collectively accounted for a substantial proportion of the observed differences in standardized compensation, with years of experience and leadership position independently associated with higher standardized compensation. Greater years of experience was a significant predictor of higher compensation (B = 875.33, β = .564, p < .001), with each additional year associated with an increase of approximately $875 in annualized salary. Position type was also significantly associated with compensation, with leadership positions having significantly higher compensation compared to staff positions (B = 25,740.14, β = .446, p < .001). After controlling for other variables in the model, pay type, other position types, and required education were not significant independent predictors of standardized compensation.
Discussion
Average annual child life compensation rates have been a long-standing question among both newly entering and long-standing CCLSs. As the first study to systematically assess practices in child life compensation across United States, these results suggest that the response will differ based on factors like pay type, position type, and work experience. An average standardized full-time CCLS rate per participants in this study appears to range from about $40,206.40 (more characteristic of entry-level staff positions) to $166,566.40 (more characteristic of leadership positions). Actual compensation data from participants also reveals that the hourly rates for child life staff range from $19.33 to $40.87, with an average hourly rate of $28.88.
For the last decade, there has been documentation of CCLSs’ concerns regarding low salary (Cross et al., 2018; Hoelscher & Ravert, 2021; Welch, 2018), despite increasing evidence for the value of the profession for pediatric institutions and broader public health (Boles et al., 2020; Romito et al., 2021). The current findings provide some potential new insights into the growing concern. First, CCLS leaders report that their CCLS team should have a salary aligning with that of social work. In 2023, the mean annual wage for healthcare social workers was $67,430 and mean hourly wage was $32.42 (U.S Bureau of Labor Statistics, 2024). The hourly salary between the two is only different by a few dollars, but that small difference may be of value. When weighing this hourly pay differential, it is important to consider differences between the two professions, such as required licensure in social work.
The current study also found that, in 2023, CCLSs typically receive annual merit raises of 3%. In comparison, the national annual inflation rate was 4.1% in 2023 (Coin News Media Group, 2026), indicating that the typical merit raise was lower than the rate of inflation. Furthermore, CCLS leaders reported employers rarely cover additional costs necessary for CCLS certification and practice (e.g., certification fees, professional membership fees, conference fees, continued education fees). Combined, these findings indicate that modest wage differences and limited financial support by employers may contribute to the longstanding concerns about compensation – and wellbeing - among CCLSs.
The study also examined relationships that appear to contribute to total salaries. At the bivariate level, compensation differed by position type, pay type (hourly versus salary), and preferred education and was positively associated with years of experience. However, after adjustment in the multivariable model, only years of experience and leadership position remained significant independent predictors of compensation. On the other hand, contrary to some anecdotal beliefs, this study found employment type (full-time versus part-time positions) and geographic region were not significantly associated with CCLS compensation. After adjustment in the multivariable model, findings revealed that the strongest independent predictors of child life compensation are greater years of experience and leadership position type.
Although educational requirements were examined as a potential predictor of compensation, education was not significantly associated with standardized compensation in the multivariable model. This finding suggests that, within the context of the current sample and after accounting for other variables in the model, differences in educational preferences did not independently explain differences in compensation. In contrast, years of experience and leadership position were independently associated with higher standardized compensation. These findings indicate that educational expectations alone may not translate directly into higher compensation and warrant further examination of how education interacts with career progression, leadership opportunities, and organizational compensation structures.
It is not surprising that years of experience and leadership roles in child life are the key factors in child life salaries. As previously noted, typically CCLSs receive annual merit raises, which will increase salary over the years. In addition, it is common among healthcare professions, such as nursing and psychology, for those in management and director roles to earn a higher salary (American Nurse Journal, 2024; Brosig et al., 2017; Kichler et al., 2020). These leadership roles include additional responsibilities, such as serving as the link between administrators and staff, managing department finances, and addressing employee engagement and workforce shortages (Kichler et al., 2020; Skytt et al., 2024; Svanstrom et al., 2025), which provides justification for higher salaries. Furthermore, as in other professions (Forsyth et al., 2021; Patarru’ et al., 2019; Svanstrom et al., 2025), the role of the leader (i.e., manager/director) has significant importance to the child life team, including supporting engagement, job satisfaction, and employment longevity (Ginter, Cahlander, et al., 2024; Hoelscher & Ravert, 2021).
Implications
The current study found that greater years of experience was independently associated with higher standardized compensation. Although this cross-sectional finding does not establish that retaining child life professionals will result in higher compensation, it highlights the importance of considering compensation across career stages. When considered alongside existing literature documenting challenges with retention in the child life profession, these findings support continued attention to strategies that promote retention. Burns-Nader, Daniels, and colleagues (2026) found opportunities for advancement, support by leadership, opportunities to engage in and follow passions within their work, and recognition of individual contributions can each help CCLSs feel engaged in their position and protected from burnout. Across healthcare, organizational investment in mentoring, onboarding, and social support are strategies that have been found to aid in retention of employees (De Vries et al., 2023). Child life leaders (managers/directors) and healthcare organizations must recognize the need to provide comparable support to CCLS staff. This could include leadership training, clinical supervision, clinical ladders, mentoring, and moments of recognition. Professional organizations, such as the ACLP, regional groups, and the Child Life Academic Society, as well as professional communities (e.g., Child Life Circle) can develop resources to support retention through mentoring, leadership development and training, and social support. In fact, some studies have already begun to explore the benefits of professional communities in providing virtual clinical supervision (Burns-Nader, Keller, et al., 2026; Holley et al., 2025).
The findings also have implications for those seeking employment in CCLS positions, specifically guidance for information to request from potential employers. Child life specialist seeking employment should inquire about annual merit raises, availability of advancement opportunities (e.g., clinical ladder, leadership roles), support in leadership development (e.g., trainings, clinical supervision, mentoring), and benefits available to cover costs associated with growth and maintenance of being a CCLS (i.e., certification fees, professional organization membership fees, conference fees). As the current findings and those of previous studies demonstrate the importance of salary in retention of CCLSs, academic and clinical internship mentors should prepare emerging professionals with the skills needed to seek employment with confidence in discussing salary, including benefits and retention, with potential employers.
It seems there is still a lot to learn about salary in child life. This study was the first step towards understanding child life compensation. During data analysis, it became apparent that several variables could have been captured more effectively through more specific spreadsheet questions. These observations provide opportunities to refine the data collection instrument for future studies. Additionally, the child life field could benefit from a longitudinal study that assesses changes in compensation and career advancement over time. Finally, even though compensation is a documented concern for child life, there is scant research on leadership experiences with navigating salary. Future studies should continue to examine salary in child life and consider addressing these aspects.
Limitations
Like all research, this study had limitations - namely the small sample size, unbalanced representation across geographic locations, and relatively homogeneous demographic characteristics of child life program leader participants. Although this is reflective of the current child life profession as a whole (Rosenblatt et al., 2024), future research and work should be done to cultivate more diverse representation and perspectives in child life leadership and reporting. Additionally, all data collected in this study, though presumed to be objective, were primarily self-reported and thus bias may be evident to some degree. Also, although variables for data collection were carefully planned, additional pieces of information such as additional certifications, or further job code and pay range details, may have enhanced the depth of insights that could be gathered.
A final limitation to note is the potential non-independence of observations among participants employed within the same institution. CCLSs within an institution may be subject to shared compensation structures, salary policies, geographic markets, and organizational characteristics, which could result in greater similarity in compensation among participants from the same institution. The current analysis did not account for potential clustering by institution; therefore, standard errors and estimates may not fully reflect the dependence among observations. Future research should recruit participants from a larger number of institutions and consider analytic approaches such as multilevel modeling to account for institution-level variation and better distinguish individual- and organizational-level factors associated with compensation.
Conclusion
These results begin to sketch an outline of the compensation landscape for the child life profession, particularly during a time when the profession is experiencing high rates of burnout, compassion fatigue, and job dissatisfaction (Burns-Nader, Daniels, et al., 2026; Fisackerly et al., 2016; Lagos et al., 2022), as well as a staffing crisis (ACLP, 2023). Previous studies have found that low salary contributes to burnout, compassion fatigue, and job dissatisfaction among CCLSs (Burns-Nader, Daniels, et al., 2026; Ehinger & Bales, 2023; Ginter, Dumas, et al., 2024; Hoelscher & Ravert, 2021). Opportunities for growth, such as leadership roles, can protect against burnout (Burns-Nader, Daniels, et al., 2026), and according to this study, increase salaries. The field of child life must continue to develop strategies to increase compensation, support retention, and promote the development and advancement to leadership roles.